
Lab Activity 4.5.1 Two-Dimensional Position Graphs

Introduction.

We saw how one-dimensional motion can be presented as a position graph with time as the horizontal axis and position as the vertical axis. But how do these ideas extend into more dimensions? It turns out that each dimension can have its own motion graphs, and that by properly aligning the motion in both dimensions, it’s possible to create the desired movements. We will be using simple flip books as the medium to help us gain a deeper understanding of this process.

Equipment List.

  • 3x5 index cards (a pack of 100 will give you enough with plenty to spare)
  • Ruler
  • Scissors
  • Pencil

Procedure.

The task will be broken into two phases. The first phase is to prepare the flipbook materials. The second phase is to create animations based on the given position graphs.
  1. Since the animations we are drawing are going to be given by graphs, it will be important that each page of the flipbook is drawn consistently, otherwise the motion will not appear the way it should. In order to be consistent, it is helpful to create a template that you will use to create all of the pages of animations with.
    • Take an index card and lay it out so that the long direction is horizontal. Measure 3 cm in from the left side and draw a vertical line. This is just a margin for the binder clip, so it doesn’t need to be perfect.
    • Measure 5 cm from the left edge and draw another vertical line. Try to get this line as close to vertical as possible. This will be the left edge of your frame. Do the same thing at 11 cm. This will be the right edge of your frame. (You may find it helpful to measure the distances at the top and bottom of the index card, and then use those two markings to get a good vertical line.)
    • Draw a horizontal line down the middle of the card. It doesn’t need to be exactly in the middle, but you should try to make it as close to horizontal as possible. Measure 3 cm above and below this line at the left and right edges of the frame and connect those points to create a 6 cm by 6 cm square. This square is the entirety of your frame.
    • Carefully cut out the square. Make 1 cm markings all the way around the square. These will be your reference markings to help you determine the coordinates of the points in your frame. Label the markings from -3 to 3 left-to-right, and again bottom-to-top. In the end, you should have something that looks like this:
      Figure 4.5.1.1. The animation template
  2. Below are several pairs of graphs that represent the x and y positions of an object that you are going to animate. Try to think through the images and make a conjecture as to the final two-dimensional behavior of the object.
    • Animation #1:
      Figure 4.5.1.2. Animation #1
    • Animation #2:
      Figure 4.5.1.3. Animation #2
    • Animation #3:
      Figure 4.5.1.4. Animation #3
  3. For each pair of graphs above, note that you have be given a total number of frames of animation that you will need to make with it. You will need to draw the correct number of vertical lines to ensure that you traverse the animation with roughly equal time steps. An example is provided below. You can choose the shape of your object, but it is recommended to keep it simple (like a circle or a square). You will want to try to draw the object the same size every frame.

Example 4.5.1.5. Sample Animation.

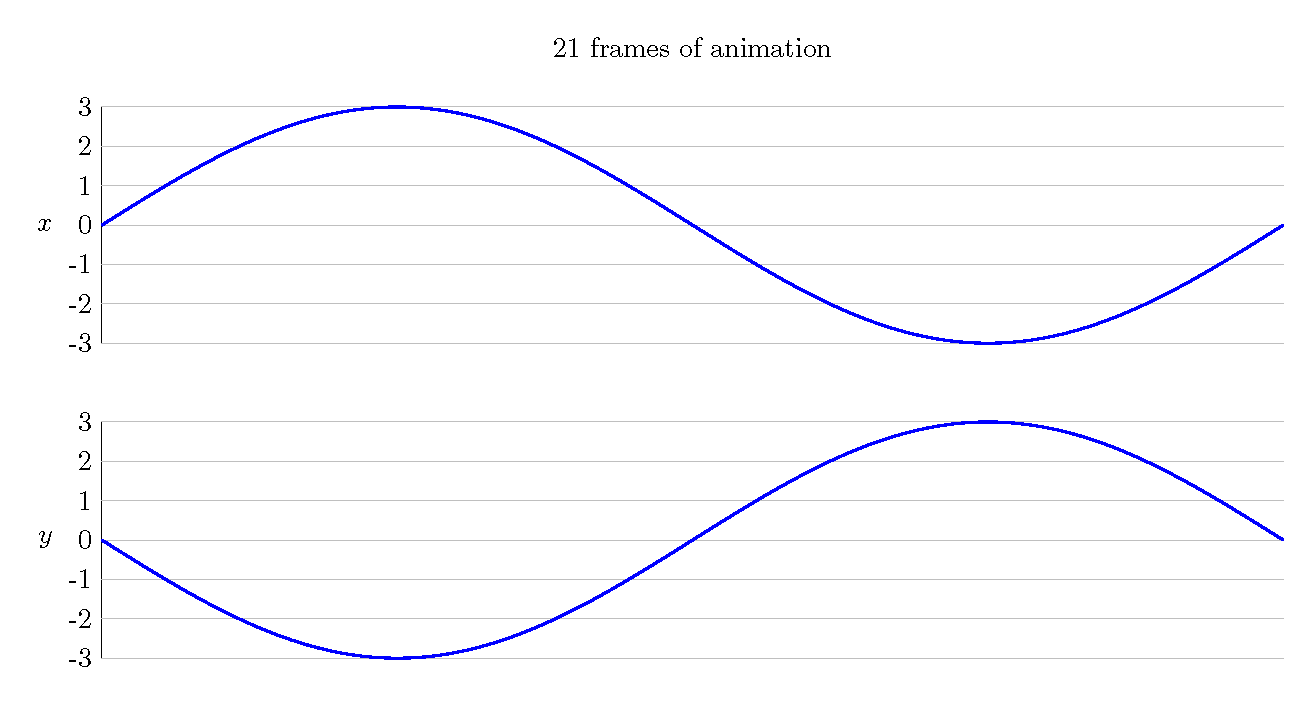
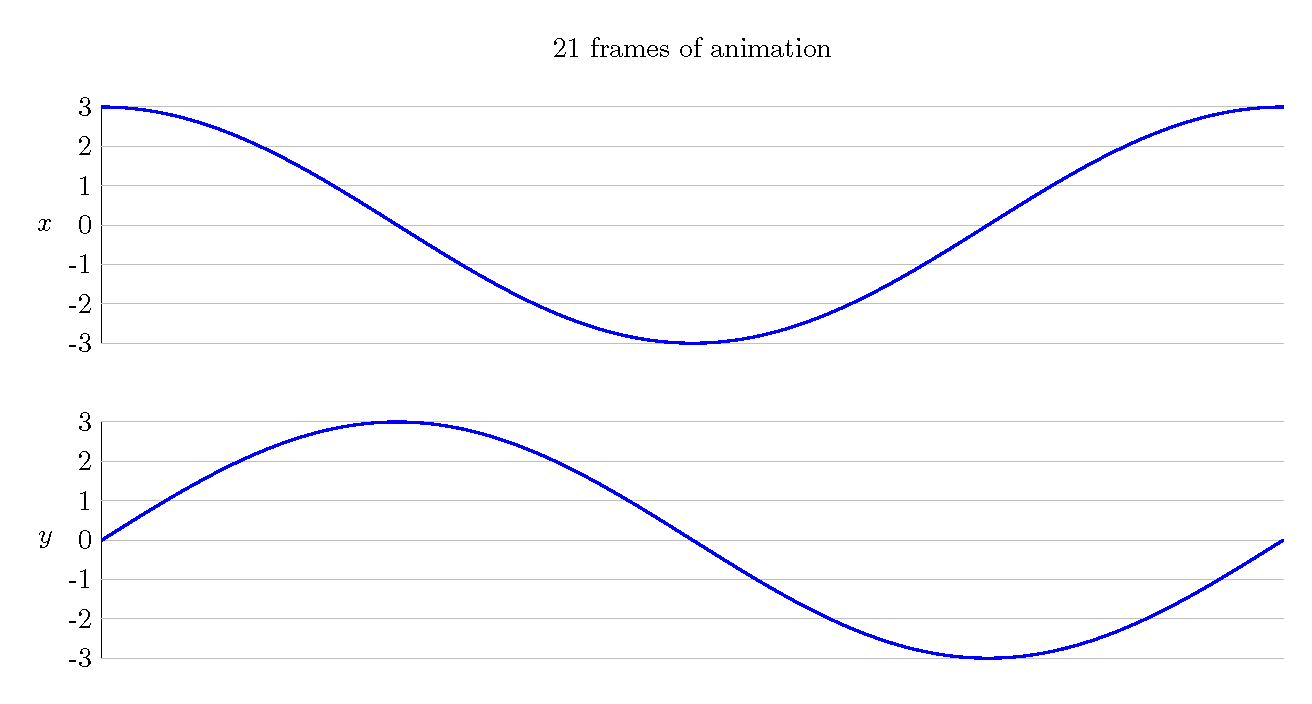
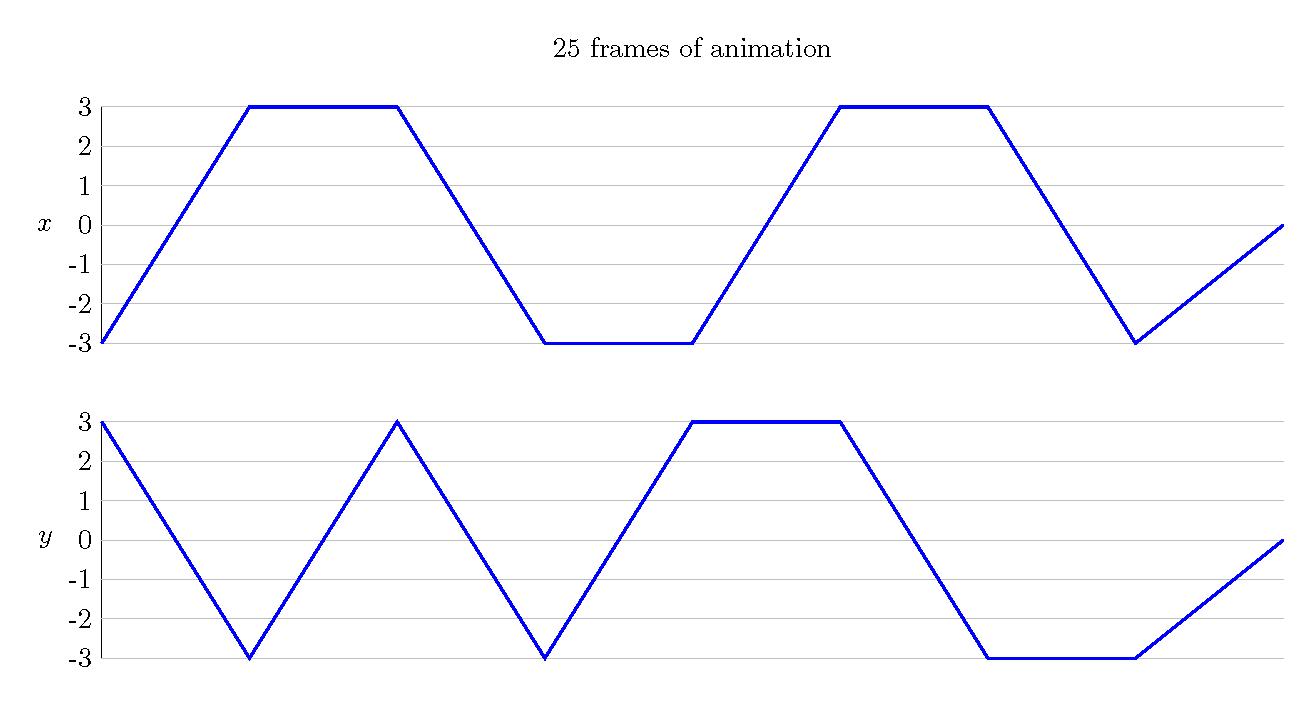
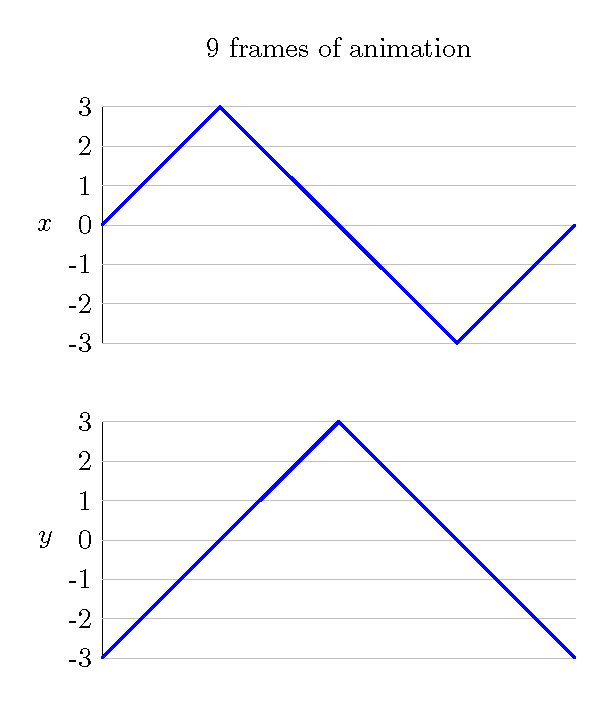
Consider the following graphs:
Figure 4.5.1.6. The original graphs
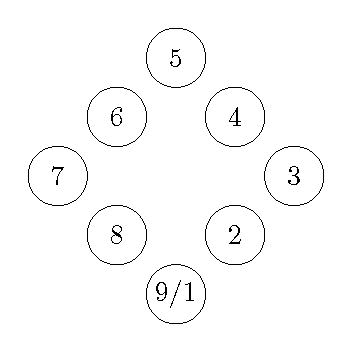
The first step is to break the animation into 9 equally-spaced frames. We will denote these frames with vertical lines. Notice that in order to get 9 frames, you must have 8 spaces. Corresponding to each frame is an x-coordinate and a y-coordinate. We have listed these under each marking.
Figure 4.5.1.7. Adding in marks for each frame
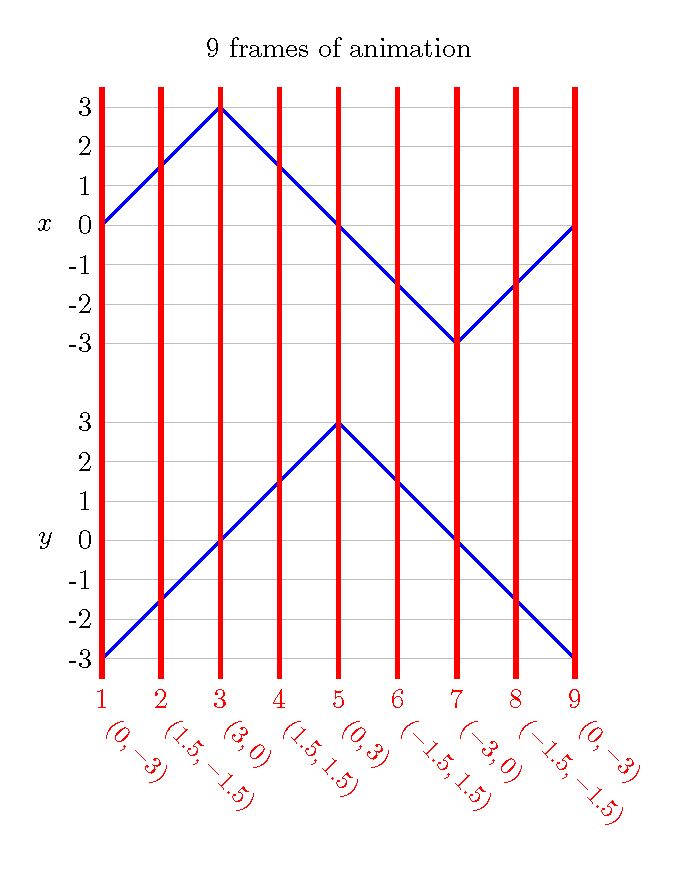
These coordinates give us the locations to draw our shape (a circle for this example), with each shape getting its own frame. All of the images are drawn together here just to save space. Also notice that frames 1 and 9 are in the same position. From this, we can see that this is the animation of an object moving around a rotated square.
Figure 4.5.1.8. A representation of the position of the circle on each frame

Discussion.

  1. What experiences have you had (before this lab) with making flipbooks animations? If you’ve made flipbooks, what are the similarities and differences between what you’ve done in the past and this lab?
  2. Were you able to correctly anticipate the motion of the object? If so, what helped you make the correct prediction? If not, do you feel that your ability to understand the motion is better now that you have done a few of these?
  3. Describe how you would do the reverse process. Suppose you knew what movement you wanted to see. How can you take that concept and then convert it into graphs of x and y positions?

Conclusion.

For this lab, we focused on just the position of the object being animated. But this same concept can be applied to a much wider range of behaviors. For example, it’s possible that one of the graphs will represent the rotation of the object or the angle of a joint. By stacking multiple layers of these graphs on top of an object, it’s possible to create extremely nuanced behaviors.

Lab Write-Up Guidance.

Use the following outline to help you write up your lab report completely and correctly.
  • Title and Header.
    What is the title of the lab and who was in the lab group?
  • Introduction.
    In your own words, what was the purpose of the lab activity? Explain how this topic is relevant to computer animation.
  • Procedure.
    Describe the process of making the template and drawing the animations.
  • Results and Data.
    Describe the results of the animations that you created from the graphs.
  • Discussion.
    Answer the discussion questions. Be sure that you state the original question and organize it in a way that is easy to follow.
  • Conclusion.
    Write a couple paragraphs about the lab. Did you find anything interesting or surprising?